
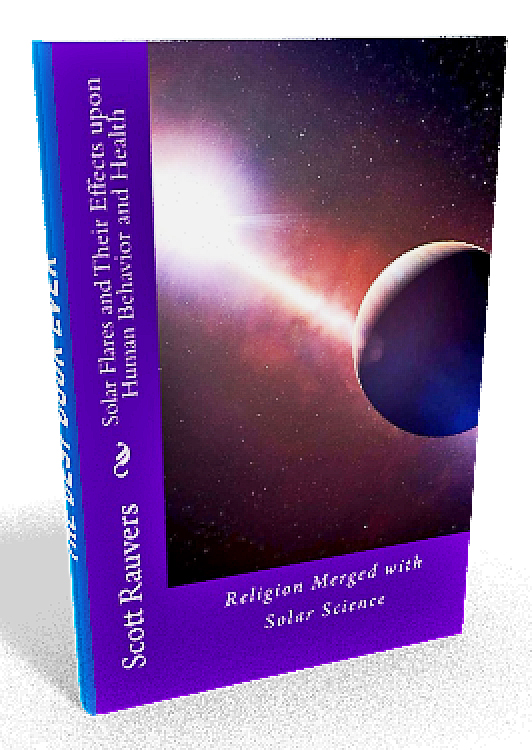
Related book - Solar Flares and Their Effect Upon Behavior and Human Health. Published July 2017
Related Articles How to Find Changes in Your Local Weather Using the Sun's Solar Flux
How Sunspots Drive Biological Evolution
According to Forbes magazine
, certain regions in Texas have had so much record breaking rainfall, the National Weather Service has had to invent new rainfall measuring equipment. In 2017, record floods have been occurring across Nepal and India.
I mentioned in my book Solar Flares and Their Effect Upon Behavior and Human Health
, released just a few months ago, that certain regions on earth may receive above average amounts of rainfall.
This is due to the fact that earth is entering a phase of very low solar activity. The last period of such low solar activity was from 1650 to 1810, known as "The Little Ice Age", which included the Spörer Minimum, from 1450 to 1530; the Dalton Minimum, from 1790 to 1820 and the Maunder Minimum, from 1645 to 1720; and the Dalton Minimum.
I state clearly in my book that scientific evidence has proven that when sunspot activity is lower, more cosmic rays will occur. This is because stronger solar activity acts as a shield against incoming cosmic rays that flood earth's upper atmosphere. The period from 2015 to 2019 is cycle of very low sunspot activity.
A paper published in nature written by Stanford researchers stated that the intensity of extremely rapid wet spells and extremely dry spells has been increasing over the decades during the south Asian monsoon season.
Reference:
Observed changes in extreme wet and dry spells during the South Asian summer monsoon season
Scientific ReferencesCosmic rays as the main factor affecting solar variability on climatic and atmospheric parameters
https://www.ncbi.nlm.nih.gov/pubmed/9914850
The influence of galactic cosmic ray on all India annual rainfall and temperature
http://adsabs.harvard.edu/abs/2015AdSpR..55.1158C
Cosmic rays, solar activity and the climate http://iopscience.iop.org/article/10.1088/1748-9326/8/4/045022
Reply to 'Influence of cosmic ray variability on the monsoon rainfall and temperature': a false-positive in the field of solar-terrestrial research https://arxiv.org/abs/1502.00505
The influence of cosmic rays on terrestrial clouds and global warming http://www.solarstorms.org/CloudCover.htm
Solar Cycle #24
.
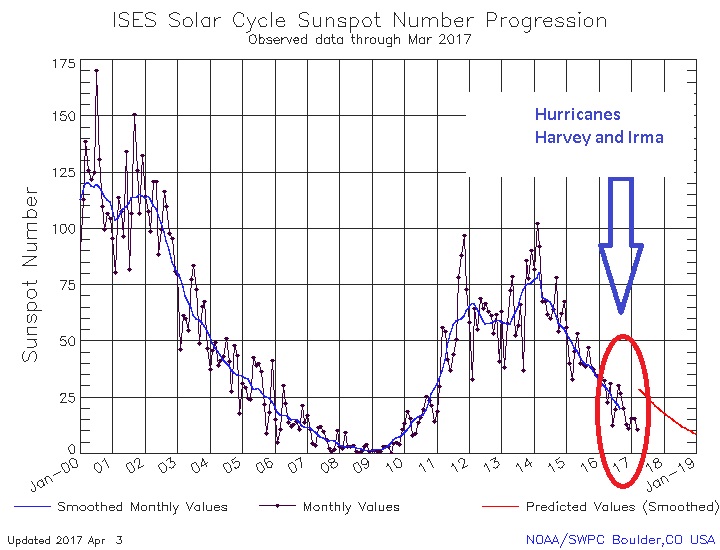
Reference: Solar Cycle #24
Sunspot Activity
As of 2017 we are in Solar Cycle 24, approaching Solar Minimum. Numbers of sunspots began their decline around 2014. During this decline, we have seen a major
increase in water moisture content in the atmosphere. This is what is responsible for the strong hurricanes. Because we are in a declining sunspot cycle, there is less solar radiation causing an effect on cosmic rays. We shall show this in greater depth later on.
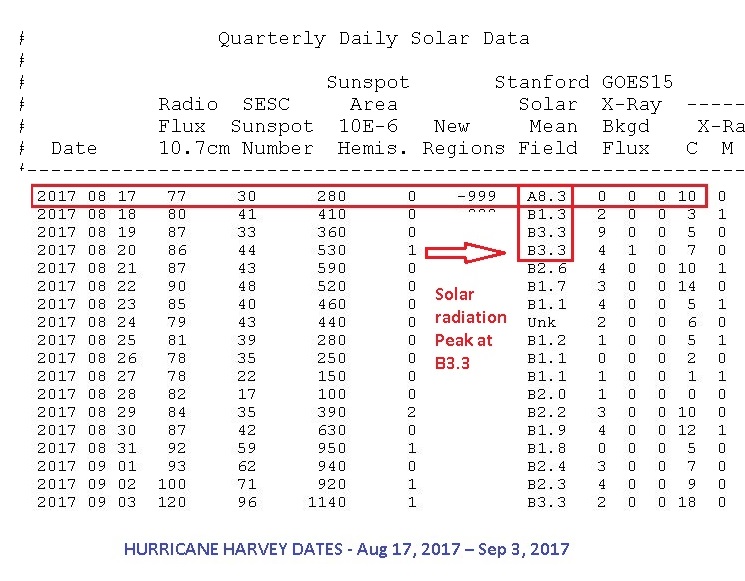
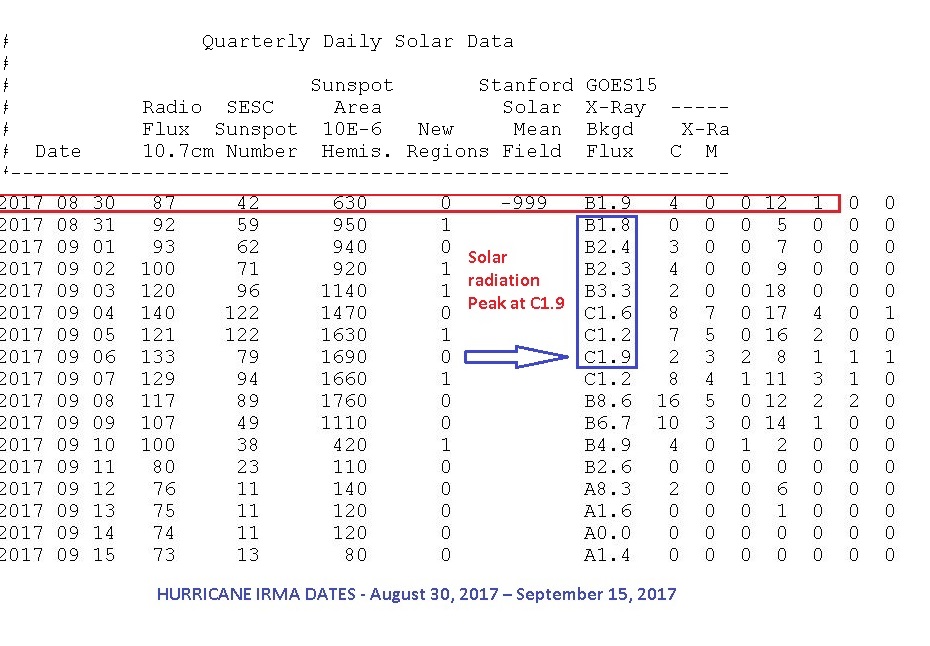
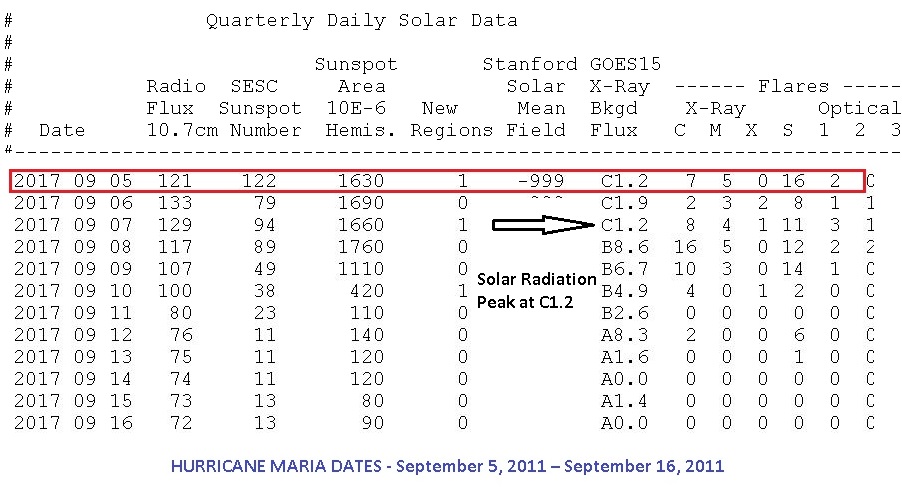
As we shall show in the following images,
when the hurricanes began first forming we see an accumulative effect in the sun's solar radiation (X-Ray Background Flux). This is what is responsible for giving the hurricane's winds a "push" creating the forces necessary for it to build up energy.
This increase in solar radiation also causes inflammation in the body. I outline this effect in greater detail along with the scientific references in the book. It is as if the effect of a solar flare leaves a lasting resonance that manifests itself over the course of a few days, playing out its effects on weather and the immune system.
HURRICANE HARVEY
 Reference:
http://legacy-www.swpc.noaa.gov/ftpdir/indices/quar_DSD.txt
HURRICANE IRMA
HURRICANE MARIA
Reference:
http://legacy-www.swpc.noaa.gov/ftpdir/indices/quar_DSD.txt
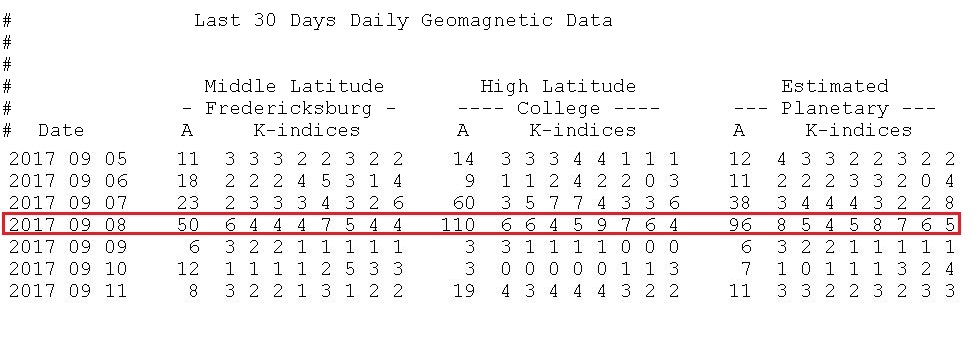
Geomagnetic Activity
Just before all the hurricane's formed,
earth's geomagnetic activity reached a high of 96. This is way above average.
Reference
http://legacy-www.swpc.noaa.gov/ftpdir/indices/DGD.txt
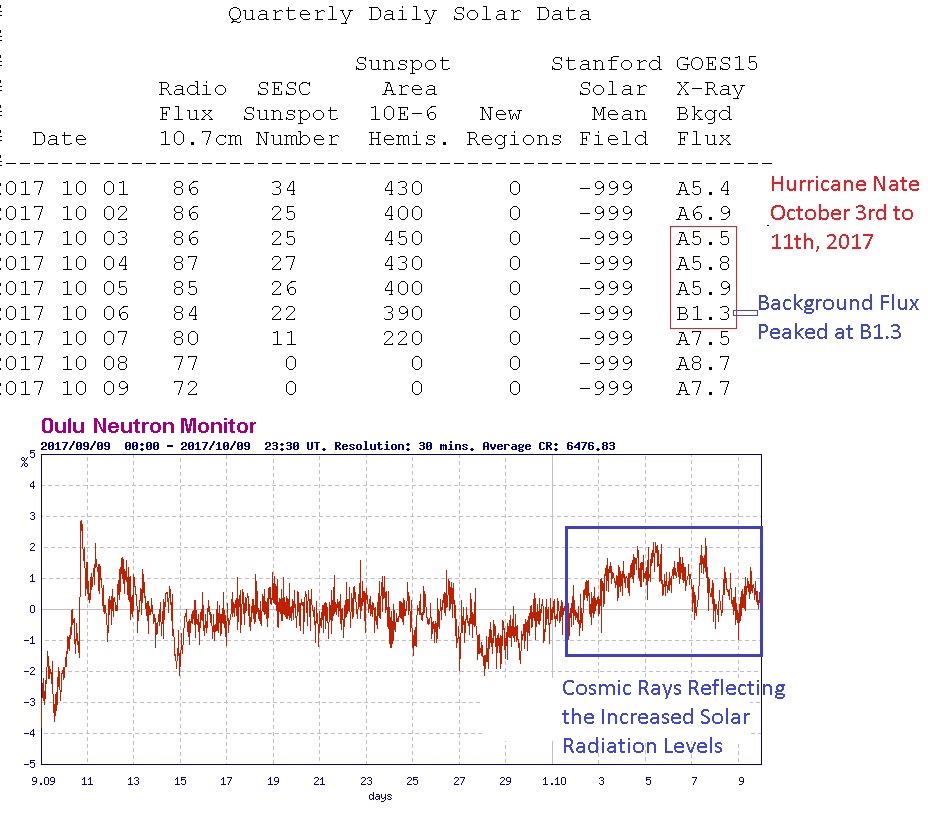
Now let's look at cosmic ray activity around the time the hurricanes formed.
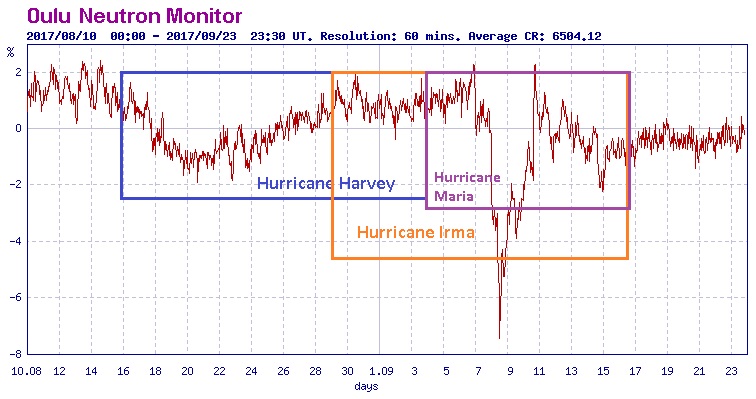
Reference. Cosmic Ray Data: https://cosmicrays.oulu.fi
Cosmic rays over the long term (shown below), we see there are less cosmic rays during sunspot minimum (which we are in now as of 2017).
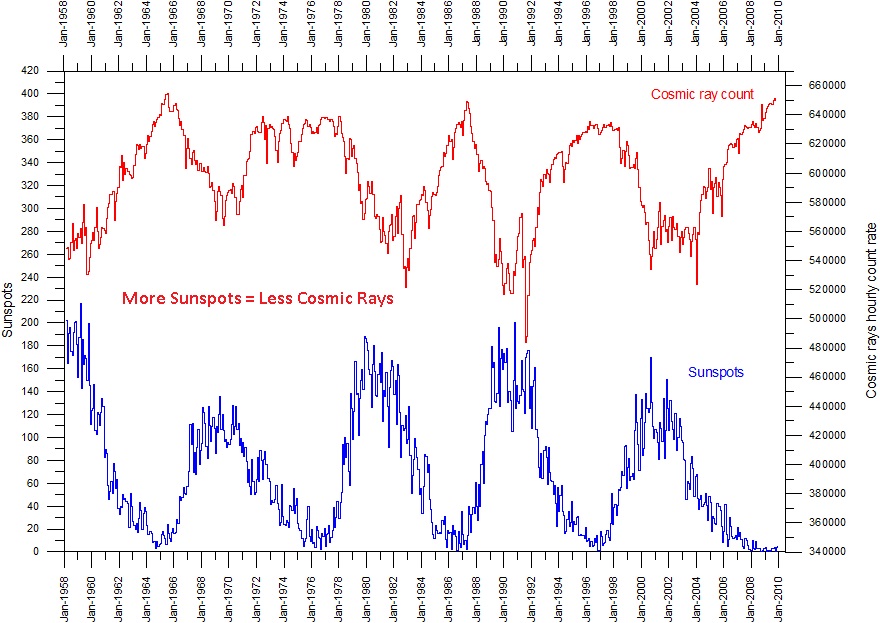
Variation of cosmic ray intensity and monthly sunspot activity since 1958 according to the Germany Cosmic Ray Monitor in Kiel (GCRM) and NOAA's National Geophysical Data Center (NGDC), respectively. High sunspot activity correlates with low cosmic ray intensity, and vice versa.
Further Reading
http://www.climate4you.com/Sun.htm
Summary
Increased solar radiation contributed to the formation of the hurricane. The
overall long term drop in cosmic rays precipitated an increase in water moisture which further enhanced the destructive nature of the hurricanes. While it is the tendency of increased solar radiation to reduce the number of cosmic rays entering earth's atmosphere, and we can see in the first cosmic ray picture that there is a dip in the numbers of cosmic rays as solar radiation increases and forms the hurricane(s), because we are in a declining solar cycle, headed towards sunspot minimum, overall long term solar radiation levels are not as strong as they would usually be if we were at sunspot maximum. Hence overall more cosmic rays are entering earth's atmosphere and making more clouds. As the previous image above shows, overall, cosmic ray counts reach highs during sunspot minimum.
How Do More Cosmic Rays Increase Rainfall?
Numerous recently published studies have shown that when there are more cosmic rays, earth makes more clouds, which then leads to more rain. I list this in more detail as well as the scientific references in the book.
Another positive feature of lower sunspot activity is enhanced intuition as I show in my 2017 book The Complete User's Manual on Experiencing Future Consciousness
, released just a few weeks ago. We have been using this cycle of lower sunspot activity to perfect our associative remote viewing skills in the Dow Jones Associative Remote Viewing Project
.
So in summary, expect more climate change as we enter a cycle of less sunspots.
Further reading. Cited References
Evidence linking solar variability with US hurricanes. Robert E. Hodges and James B. Elsner http://onlinelibrary.wiley.com/doi/10.1002/joc.2196/abstract
United States and Caribbean tropical cyclone activity related to the solar cycle
https://ams.confex.com/ams/28Hurricanes/techprogram/paper_137081.htm
Solar forcing of regional climate change during the Maunder minimum.
http://citeseerx.ist.psu.edu/viewdoc/download?doi=10.1.1.448.6499&rep=rep1&type=pdf
The middle atmospheric ozone response to the 11-year solar cycle.
https://link.springer.com/chapter/10.1007%2F978-0-387-48341-2_22
Dissipative heating and hurricane intensity.
https://link.springer.com/article/10.1007/BF01030791
Tropical cyclones and global climate change..
http://journals.ametsoc.org/doi/abs/10.1175/1520-0477%281998%29079%3C0019%3ATCAGCC%3E2.0.CO%3B2
The Role of the Sun in Climate Change.
http://library.uniteddiversity.coop/Climate_Change/The_Role_of_the_Sun_in_Climate_Change.pdf
Amplifying the Pacific climate system response to a small 11 year solar cycle forcing.
http://science.sciencemag.org/content/325/5944/1114
Solar Variability and its Effects on Climate.
http://onlinelibrary.wiley.com/book/10.1029/GM141
The Relationship between Cosmic Rays and Hurricanes
http://www.breadandbutterscience.com/The_Relationship_between_Cosmic_Rays_and_Hurricanes.pdf
Cosmic rays activity and monthly number of deaths: a correlative study.
https://www.ncbi.nlm.nih.gov/pubmed/12099402