
News
01-27-2013
 New Books
Visit the Books Page on the homepage to See our Latest Releases
New BooksVisit the Books Page on the homepage to See our Latest Releases

October 23rd, 2019 - Special Notice
After much careful consideration and research the solar weather analysis for shooting rampages is no longer being conducted. This is due to the fact that NOAA solar weather has ceased archiving / saving their historical solar weather data. All data is now being archived by from third party sources ( solen.info and spaceweatherlive.com ). You can read about how unfavorable solar weather conditions contribute to mass shootings on the How Excessive Geomagnetic Energy Causes Psychological Outbreaks of Violence page or by reading the book Solar Flares and Their Effect Upon Behavior and Human Health . Solar weather analysis / forecasting for the in2itivetech.com ARV project will still continue. This is because the forecasting is in real time and no archived data is necessary.
View a Simplified Version of the Solar Condition Colors
by clicking on the address below:
http://www.ez3dbiz.com/pdf_docs/solar_activity_behaviour_health_effects.pdf
View the old reserach page of the condition colors by clicking on the address below:
http://www.ez3dbiz.com/historical_research_page.html
Related Article:
How Lower Levels of Serotonin Make Some People More Prone to Violence
Read the first 3 chapters of the book published by EZ3DBIZ.com, Solar Flares and Their Effect Upon Behavior and Human Health
March 15th, 2019 Christchurch Shootings Solar Weather Analysis
Analysis of the Las Vegas Country Music Shooting Festival Massacre
October 2nd, 2017
All indications were of a condition orange
. Solar weather however was at low speeds. Geomagnetic activity peaked 24 hours before and Sunspots were dropping for more then 2 days in a row. This pattern is consistent with the Florida Nightclub shooting as well as the 911 and Boston Maraton Terrorist attacks as well as other large acts of violence that injure or kill more than a dozen people. More details can be found further down this page.
Reference http://legacy-www.swpc.noaa.gov/ftpdir/indices/DSD.txt
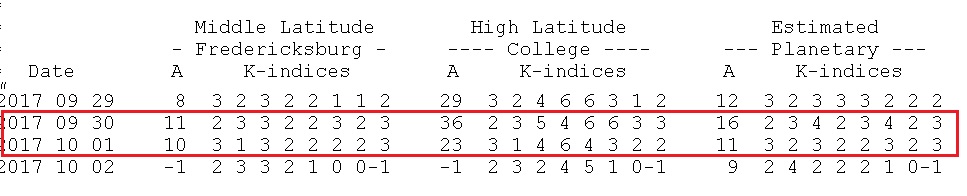
Reference
http://legacy-www.swpc.noaa.gov/ftpdir/indices/DGD.txt
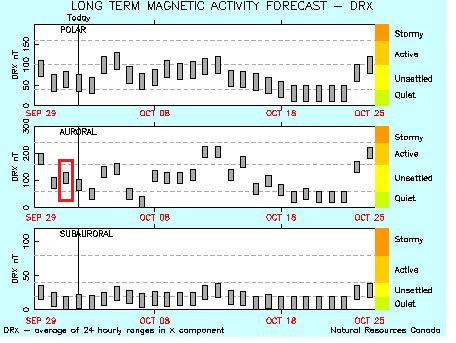
Reference http://www.spaceweather.gc.ca/forecast-prevision/long/sflt-1-en.php
Scientific Confirmation linking stronger geomagnetic activity to terrorist attacks
As we have been showing on this
page for the last 3 years the following scientific studies confirm the theory that not only stronger geomagnetic activity creates an enhanced risk of terrorist attack but also confirms our theory that higher solar speeds are also responsible.
Page 170: Do unseen, very weak magnetic mechanisms contribute to terrorism?
Page 174: " with an intensified amplitude during the years when not only terrorist activity but solar wind speed and the geomagnetic index were all amplified. This result (Halberg et al., in preparation) awaits further scrutiny
,"
The above excerpts are from the scientific paper titled: Cycles Tipping the Scale between Death and Survival.
Authors: Franz Halberg, Germaine Corn´elissen, Robert B. Sothern, George S. Katinas, Othild Schwartzkopff1 and Kuniaki Otsuka.
Halberg Chronobiology Center, University of Minnesota, Minneapolis, MN 55455, USA and the Department of Medicine, Tokyo Women’s Medical University, Medical Center East, Tokyo 116-8567, Japan.
Scientific Paper link
http://citeseerx.ist.psu.edu/viewdoc/download?doi=10.1.1.823.9126&rep=rep1&type=pdf
The above image shows a major disturbance in earth's geomagnetic activity during the terrorist attacks on 911. The image is courtesy of the scientific paper titled: The Global Coherence Initiative: Creating a Coherent Planetary Standing Wave
, published by Rollin McCraty, PD. Corresponding authors Annette Deyhle, PhD, and Doc Children.
Scientific paper link
https://www.ncbi.nlm.nih.gov/pmc/articles/
PMC3833489/
Our current findings so far as to the cause of shooting massacres that affect 12 or more people is that because sunlight creates serotonin in the brain, when sunlight levels are reduced, it can cause increased aggression. This also leads to the finding that more mass shootings occur from July to November each year, a time of decreasing sunlight.
Serotonin and aggression
http://www.ncbi.nlm.nih.gov/pubmed/15817750
Escalated aggressive behavior: dopamine, serotonin and GABA.
http://www.ncbi.nlm.nih.gov/pubmed/16325649
Additional References:
"Exposure to bright light is a second possible approach to increasing serotonin without drugs"
http://www.ncbi.nlm.nih.gov/pmc/articles/PMC2077351/
" the frequency of occurrence of bursts exceeding the average number of hospitalized patients with mental and cardiovascular diseases during magnetic storms increases approximately 2 times compared with quiet periods
"
http://www.ncbi.nlm.nih.gov/pubmed/11605400
Serotonin and suicidal behavior
http://www.ncbi.nlm.nih.gov/pubmed/2252327
Suicide, serotonin, and the brain.
http://www.ncbi.nlm.nih.gov/pubmed/11727896
Serotonin, suicide, and aggression: clinical studies
http://www.ncbi.nlm.nih.gov/pubmed/1721619
Functional imaging, serotonin and the suicidal brain. K. Audenaert et al. September 2006.
http://www.ncbi.nlm.nih.gov/pubmed/17091615
Junk Food and Serotonin
Aspartame Reduces Serotonin Levels
http://www.ncbi.nlm.nih.gov/pubmed/2442082
A refined high carbohydrate diet is associated with changes in the serotonin pathway and visceral obesity
http://www.ncbi.nlm.nih.gov/pubmed/26707058
" Low levels of serotonin are associated with increased carbohydrate cravings (commonly found in junk foods) depression heightened sensitivity to pain, and troubled sleep patterns
" (Page 144)
Book: Somer, Elizabeth, M.A., R.D. Food & Mood. Henry Holt and Company, LLC, 1999.
Quote from study " Evidence is presented that carbohydrate snacking seems to be related to a "need" to increase the level of brain serotonin
"
Study Reference: The involvement of brain serotonin in excessive carbohydrate snacking by obese carbohydrate cravers.
http://www.ncbi.nlm.nih.gov/pubmed/6381575
Solar Weather Analysis of France Truck Terrorist Attack on July 14th, 2016 took place during a strong condition orange.
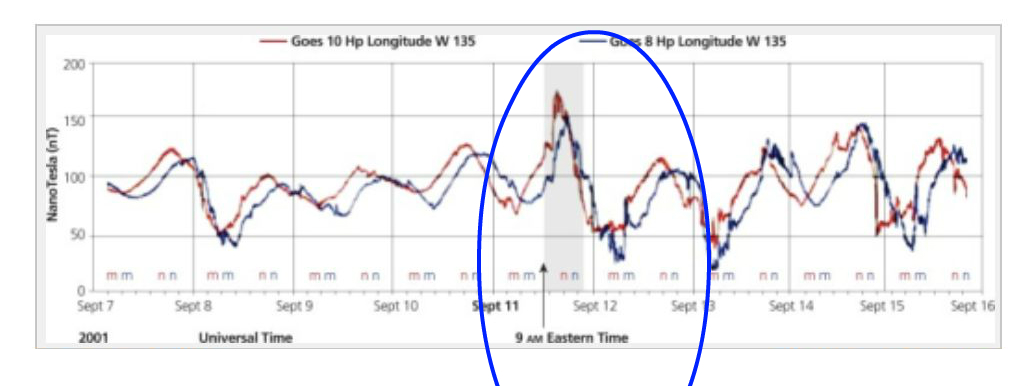
Interpreting Solar Weather historical Data by Cal Tech
By using a day date calendar
to interpret Cal Tech's Historical Solar Wind data we get
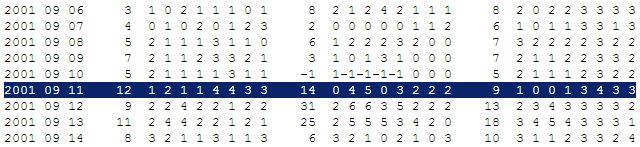
September 11th, 2011 as day 254.
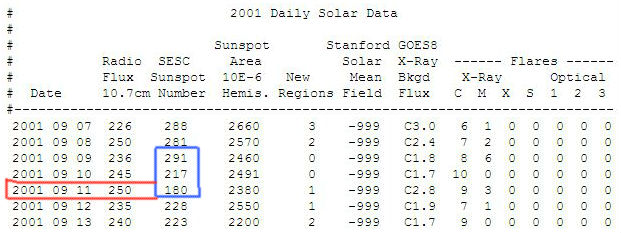
As shown in the image below, on September 11th, 2001, solar wind speeds showed a sudden increase to unfavorable speeds.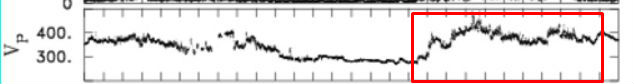
Source: Cal Tech Historical Solar Wind Data
http://www.srl.caltech.edu/ACE/ASC/DATA/level3/mag/magswesummary.cgi?LATEST=0&YEAR=2001&MONTH=9&DAY=11&DOY=-1
Dallas Civil Unrest. July 7th, 2016
The Solar Activity Analysis of the Dallas Civil Unrest
shows a strong condition orange occuring on July 7th, 2016.
The Boston Marathon Attacks
Taking a look at the Boston Marathon Bombing that occured on April 15th, 2013, we once again see all the indicators of a strong condition orange.
A decline in Sunspots
Source: NOAA
http://legacy-www.swpc.noaa.gov/ftpdir/indices/old_indices/2013_DSD.txt
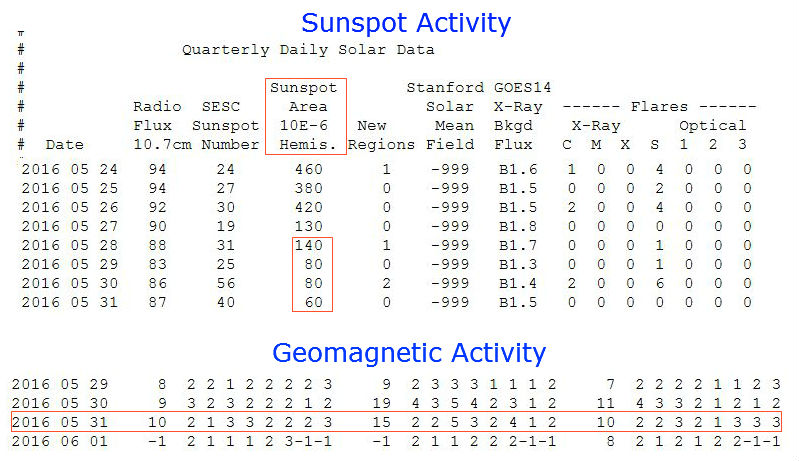
A peak in KP activity, although it was 24 hours previous. This shows the individuals may have had second thoughts in regards to their actions.
Source: NOAA
http://legacy-www.swpc.noaa.gov/ftpdir/indices/old_indices/2013_DGD.txt
And once again, we see that solar wind speeds were out of the favorable range.
Source: SOLEN Historical Solar Weather Data
http://www.solen.info/solar/old_reports/2013/april/20130416.html
The Solar Analysis Report on the June 13th, 2016 Florida Nightclub Shooting shows the same 3 indicators: A drop in sunspots, unfavorable solar wind speeds and an increase in KP activity.
Solar Activity Analysis of the June 1st, 2016 UCLA Shooting
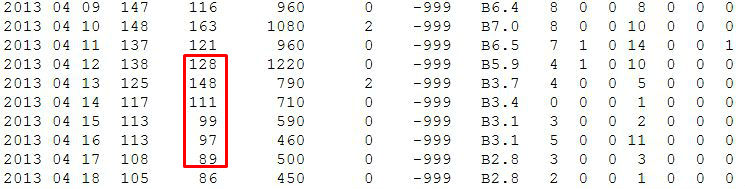
The UCLA Shooting that occurred on June 1st, 2016 showed all the conditions of a condition orange. These are the same conditions that occur during terrorist attacks and mass shooting rampages.
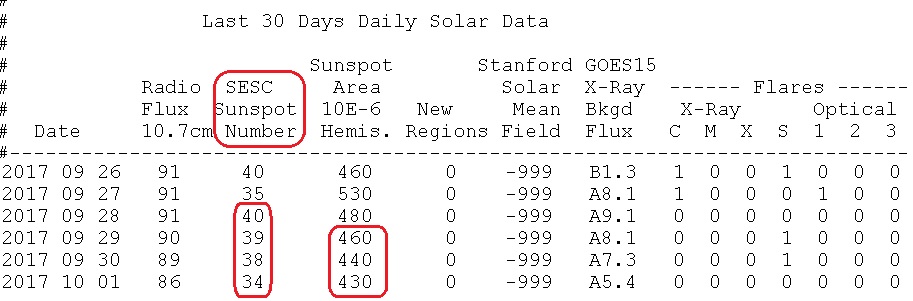
Sunspots:
A decline in the Sunspot Area 10E-6 Hemis region indicating a "Condition Orange" period.
While sunspots are not a perquisite for a condition, orange, the 10E-6 Hemis is an indicator of declining solar activity, which still
alters serotonin levels.
Geomagnetic Activity:
A Peak in Geomagnetic Activity Levels, indicative of a "Condition Orange" period.
Solar wind speed was at close to 500 (out of favorable speeds). Another indicator that can aggravate a condition orange.
Sunspot Data
http://legacy-www.swpc.noaa.gov/ftpdir/indices/old_indices/2016Q2_DSD.txt
Solar Wind Speed
ftp://ftp.swpc.noaa.gov/pub/lists/ace2/201606_ace_swepam_1h.txt
Geomagnetic Data
ftp://ftp.swpc.noaa.gov/pub/indices/old_indices/2016Q2_DGD.txt
Solar Weather Analysis of the 13th to 14th November 2015 Paris Attacks. A Strong Condition Orange was present.
Solar Weather Analysis of the December 2nd, 2015 San Bernadino Massacre. Condition Orange Present.
Hypothesis - Repeating the Past
Stronger then average geomagnetic storms seem to be causing the past to repeat itself. This is evidenced in the repeated pattern of outbursts of violent behavior. In the book titled: Wormhole Theories, Sunspot Activity and Remote Viewing Stocks
, published by the Solar Institute, we tested the scientific theory that during lower/quiet geomagnetic activity that remote viewing the future, accuracy was enhanced. This proved to be correct. So if stronger geomagnetic activity is repeating the past, then quiet geomagnetic activity must be creating/repeating the future?
Human Growth Hormone
Another interesting fact is research at the Solar Institute showed that when using Niacin to enhance Human Growth Hormone,
that the effects were substantially increased during times of stronger then average geomagnetic activity. Considering Human Growth Hormone is a hormone that we have when we are younger, this would make sense that it its effects would be stronger during stronger then average geomagnetic activity. HGH levels are more plentiful in our body when we are young and decline as we grow older.
Geomagnetic Activity and Genes
It has been scientifically confirmed that people born during fall live longer then average
. Geomagnetic storms have 2 seasonal peaks. These are Spring and Fall. Could the reason people born during fall live longer due to their genes being influenced by the stronger then usual geomagnetic activity? There is already scientific evidence showing that people born during winter and spring are more suseptible to Schizophrenia.
Additional Reading
Mechanisms of Geomagnetic Field Influence on Gene Expression
http://www.ncbi.nlm.nih.gov/pmc/articles/PMC2872305/
The Link between Ecstasy and Serotonin
Stephany Biello at Glasgow University in Scotland, announced in June 2000 findings linking the drug, ecstasy, to long-term damage to the body clock. Ecstasy plays havoc with serotonin and may exert such a negative impact on the pathways of serotonin release in the pineal gland that it permanently alters the brain's ability to manufacture that vital hormone. The drug, can induce serious sleep and mood disorders as well as severe depression.
The Link between Ecstasy and Some Terrorist Attacks
Although not all terrorist related events may be linked to Ecstasy, it is interesting that the Paris Attackers had taken Ecstasy before they committed their acts as published in the article titled:
Terrorists Took Ecstasy and 'Love Drugs' Prior to Paris Attack
It is interesting that treatment of ecstasy seems to have increased since the time of violent shooting attacks in the United States.
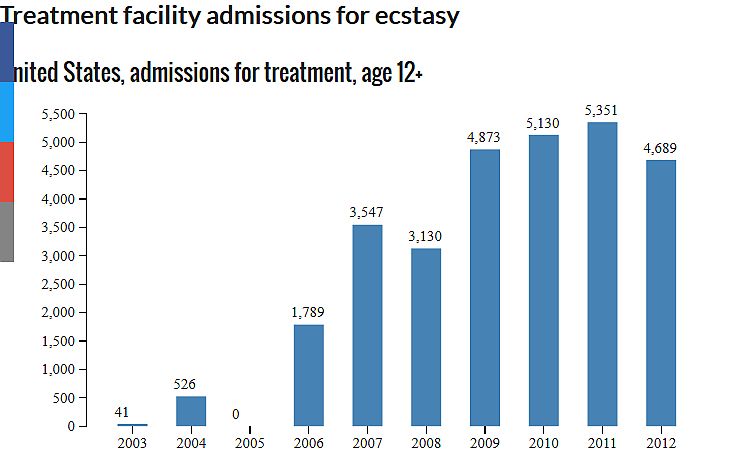
Source:
http://drugabuse.com/library/ecstasy-history-and-statistics/
Could one way to solve the mass shooting problem be in tackling Ecstasy?
Also because future solar and sunspot activity is expected to further decline in the future.
This could mean this trend may continue for a while longer.
Supporting Scientific Evidence Linking Strong Geomagnetic Activity and Mental Health
Study #1: Do ambient electromagnetic fields affect behavior? A demonstration of the relationship between geomagnetic storm activity and suicide
.
> Quote from Study:
"The average number of suicides was greatest in spring for males and females, and lowest in autumn for males and summer for females. Suicide among females increased significantly in autumn during concurrent periods of geomagnetic storm activity (P = .01). This pattern was not observed in males (P = .16). This suggests that perturbations in ambient electromagnetic field activity impact behavior in a clinically meaningful manner"
Source:
http://www.ncbi.nlm.nih.gov/pubmed/16304696
Study #2: Biotropic effects of geomagnetic storms and their seasonal variations
Quote from Study:
"the frequency of occurrence of bursts exceeding the average number of hospitalized patients with mental and cardiovascular diseases during magnetic storms increases approximately 2 times compared with quiet periods"
Source:
http://www.ncbi.nlm.nih.gov/pubmed/11605400
Study #3: Medico-biological effect of natural electromagnetic variations
Quote from Study:
" Comparison of geomagnetic and medical data rows has shown that at least 75% of magnetic storms caused increase in hospitalization of patients with suicides, mental disorders, myocardial infarction, defects of cerebrum vessels and arterial and venous diseases on 30-80% at average
."
Source:
http://www.ncbi.nlm.nih.gov/pubmed/9914847/
Additional Studies:
Study Title: Mechanisms of Geomagnetic Field Influence on Gene Expression
" Recent studies demonstrate distinct changes in gene expression in cells exposed to a weak magnetic field (MF). Thus, MFs and solar cycles-dependent geomagnetic field fluctuations are capable of altering expression of genes. Duration of geomagnetic storm average between one or two days, at this period amplitude of magnetic field fluctuations may vary from 200–300 nT and until 1000 nT, which exceeds normal background values in different frequency bands by 5,000–10,000-times. Intensity of industrial magnetic fields can amount up to 120 μT, but contribution of the industrial (artificial) magnetic fields in total average intensity of environmental magnetic field is rather small because of mutual compensation (cancellation) of industrial magnetic fields.
"
Source:
http://www.ncbi.nlm.nih.gov/pmc/articles/PMC2872305/
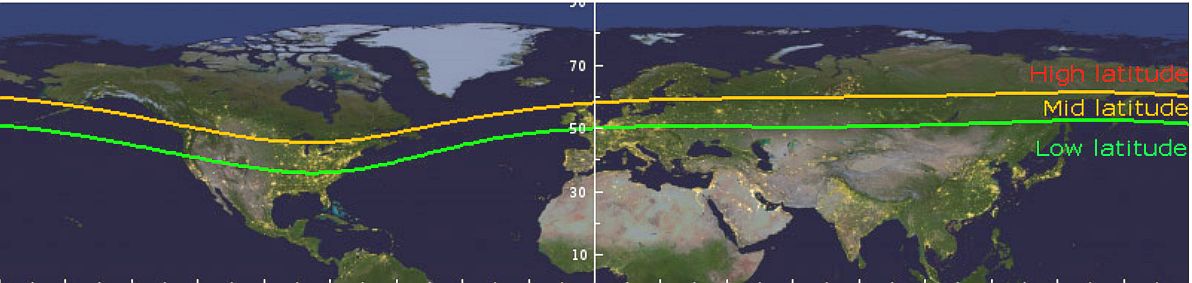
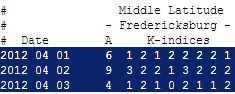
Geomagnetic Storm and Region
" Three conclusions are that geomagnetic effects are more pronounced at higher magnetic latitudes, that extremely high as well as extremely low values of geomagnetic activity seem to have adverse health effects and that a subset of the population (10–15%) is predisposed to adverse health due to geomagnetic variations
"
Source:
http://link.springer.com/article/10.1007%2Fs10712-006-9010-7
Below is a map showing high, low and medium latitudes in the Northern Hemisphere.
View a Simplified Version of the Solar Condition Colors
by clicking on the address below:
http://www.ez3dbiz.com/pdf_docs/solar_activity_behaviour_health_effects.pdf
Additional Info:
Pineal gland biorhythms: N-acetyltransferase in chickens and rats.
http://www.ncbi.nlm.nih.gov/pubmed/786737
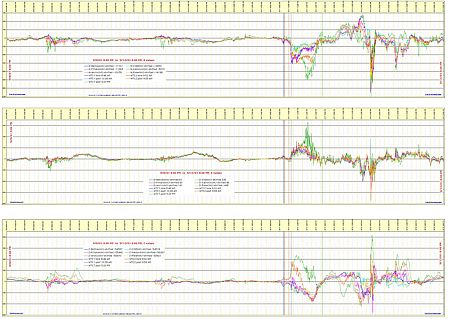
Above is 96 hours of magnometer data (measurements of the earth’s magnetic field.) from three different stations on the day of September 2001. On September 11, 2001 and shortly afterwards there is a clear spike in activity. Here we have humans reacting to earth magnetic activity and the earth’s magnetic field reacting to human activity. This shows that a collective effect of consciousness has an effect on the earth.
http://www.drjudywood.com/articles/erin/erin5.html
Conclusion, Hypothesis and Summary
While the condition Orange Pattern is not relevant at every mass shooting, there is one constant. A recurring trend occurs that 8 or more people are injured or killed during strong condition orange periods and that the largest events in U.S. attacks such as 911, the Boston Marathon Bombing and the Florida Nightclub Shooting all occurred when the 3 main variables were present. This leads to the conclusion that these events that occur when the condition orange solar activity is present, have a much larger impact on society as a whole, compared to attacks that occur when the 3 solar variables are not present. The three solar variables being 1: Decline in Sunspots for the previous 48 hours. 2: A peak in earth's Geomagnetic Activity and 3: An increase in Solar Winds to unfavorable speeds (above 320)
The Remainder of the following data below are 5 + years of research leading up to the identification of condition oranges and how they impact human society. This data is "as is" and has not yet been summarized into an organized format.
EZ3DBIZ Analysis of the Ferguson Riots of 2014 August, 10th 2014, the date of the riots, The Solar Health Condition was
100% Orange -
View what makes a condition orange by visiting this page
Solar Wind Speeds (courtesy of LockHeed) began high speeds for next 8 days:
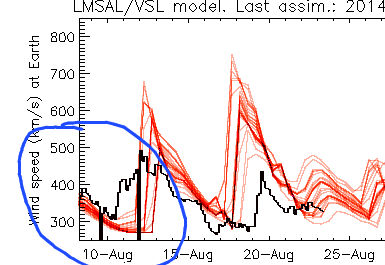
Increasing and Stronger KP Levels (motivating)
From August 11th to August 13th
, there was a decline in Sunspot Hemis Area ( condition orange)
The above period was just after the supermoon of the year, a time of increased stress. The next supermoon is not until September of 2015.
Global Consciousness Projectand the 911 Random Event Generator Data
http://www.boundaryinstitute.org/bi/randomness.htm
Full Analysis by the Global Consciousness Project
http://www.lfr.org/lfr/csl/library/sep1101.pdf
Recently Added: Hormone Levels, Violence and How to Stabilize Hormone Levels Naturally
It is now a scientifically confirmed fact that Ions affect the Human autonomic nervous system.
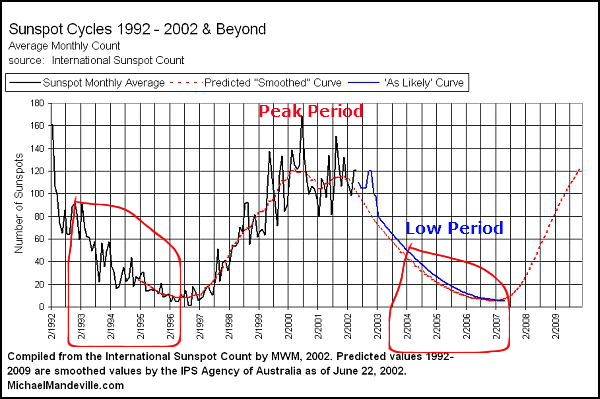
* From the years 1993 to 1996, a period of declining and lower sunspot activity, there were only 3 reported mass incidents.
*The next increasing period of sunspot activity was from 1997 to 2001. There were 8 reports of mass shootings during this period.
* Between 2004 and 2007, a lower period of sunspot activity, there were only 5 incidents.
Image #1 Below
The Arab spring uprising began during our current increase in sunspot numbers. This peak will be reached by late 2014 at the latest, when we can expect a decline in worldwide conflict, and a time of increasing stability among nations. The real danger at this point in solar activity is twofold. If the crisis in the middle east spreads, it could very well turn into a worldwide conflict, one scenario being Russia,. China or both nations object to an invasion of Iran or continued encroaching U.S. Troops close to their borders. The 2nd danger is worldwide monetary collapse. This would mean the U.S. Dollar would either go through a ,reset period where the debt was forgiven or it would lead to a completely new type of monetary system. Whatever the outcome, we can expect things to rapidly and radically change over the next 2 years. Hopefully these changes are going to lead towards more accountability for our elected officials and the understanding that increased sunspot cycles make an excellent gauge to hear the public out, and make beneficial changes that benefit all classes and social circles in our society.
Our research has also shown that prolonged condition purples(3 days or more)
cause outbreaks of violent behavior. Condition purple periods are when the solar activity goes "FLAT" or quiet. As will be demonstrated later on in this article, the sun's energy or sunlight hours start decreasing after the June summer solstice, and our research has shown that this time of year more violence occurs. So this proves that when overall solar activity starts decreasing, especially when sunspot levels start decreasing, which we at ez3dbiz.com call a "condition purple" period, it leads to an increased risk of outbreaks of violent behavior. What is most interesting is that after 2014, we are going to see a huge decline in solar activity, so this will be one of the most critical periods to watch for major events. Hopefully, and I believe, that this cycle will pass on to a new brighter period of growth for earth and its people.
A condition color is strongest during the first 24 to 48 hours. This means that a recent condition orange or purple has the most pronounced effects, especially if it around a new moon period.
What is most interesting is that condition purples do not harbor as many fatalities as a condition orange. So in summary, we can expect violent shootings and violence to occur during a condition purple period, but with fewer victims.
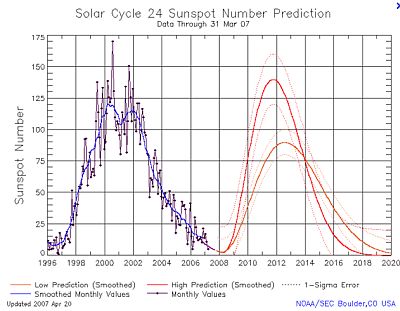
* Moving onto the next sunspot cycle (sunspot cycle #24 shown below), which started increasing in 2008 and will peak between 2012 and 2013, we have 10 incidents so far. There is a possibility of more incidents from June until December 2013. Hopefully this trend will not show itself, but historical data makes it hard to think otherwise.
Image #2 Below
Into the Future
There are 2 things that resonate closest to the suns energy
1: Human Emotion
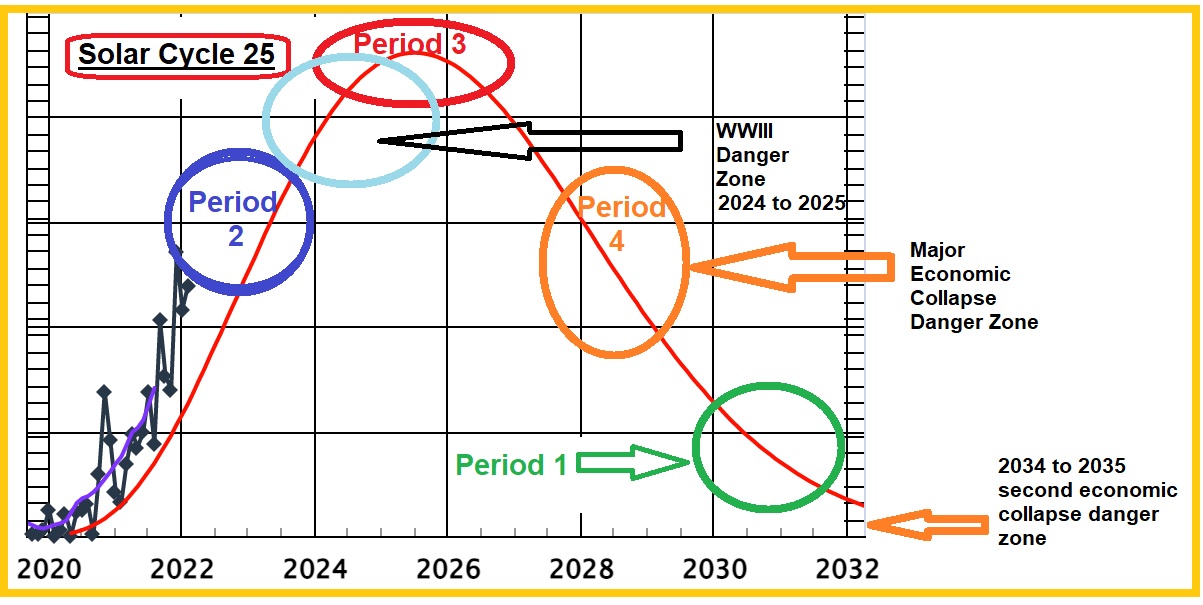
2: Computers. During the 2000 peak solar cycle there was a huge Internet boom. During our current solar cycle (2013) there has been a huge social networking boom, which also is making huge changes in societal structure. So I can easily predict the power of social networking will be replaced by 2025, the next peak of the solar cycle. So it will be interesting to watch for the emergence of a new form of computerized media that will change societal structure again during 2025.
Image #3 Below
Getting back to studying seasonal trends and violence affecting large numbers of the population, we find that the majority of these incidents take place just after the June summer solstice lating until the December Solstice. From this we conclude that during increasing solar activity, the effects of this higher energy can create more mental imbalances in disturbed individuals, who carry out random acts of violence against the public.
We can clearly see that during a low period of sunspot activity, mass shootings take place after the June Solstice, which is a time of decreasing sun strength, as well as days of longer darkness (less hours of daylight), with another peak occuring during the months of April. These are all periods of the year when the suns activity has peaked, April being the peak or first increase in solar activity after the Feb/March Equinox and again after the peak of visible daylight at the June Summer solstice (the period where the suns light starts waning until it emerges again at the December solstice). For some individuals, it ushers in a period where more personal frustrations occur more than usual due to coping with situations and results that were successful before, no longer are getting the results they used to.
We also see this pattern/formation of solar activity clearly mentioned in the bible.
" One miracle occurs when the sun is in Gemini. This occurs just before the summer solstice. 1.The sun heals a Man with a Withered Hand (Matt. 12:10). So far we have twelve miracles occurring at the time of the year when daylight hours are increasing and when they exceed nighttime hours. From now on daylight starts to decrease. This was seen as a battle between the sun and the dark forces
."
Source Courtesy of U.S. Bible.com
With the exception of the 2001 terrorist attacks in New York City, the rest of this page goes into detail about what causes the motivation and how earth's geomagnetic activity is partly involved. We will cover the dates from shooting events that occurred during the period 2007 to 2012, a period of rising and increasing sunspot activity.
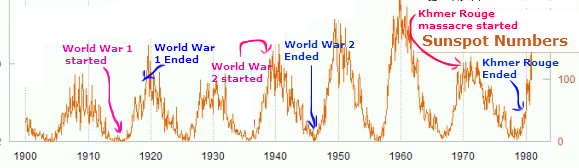
World War 2. Began September 1, 1939 ( AT THE PEAKOF ANOTHER SUNSPOT CYCLE), when Germany invaded Poland. It ended on September 2, 1945 with the surrender of Japan during a decline in sunspots.
The Khmer Rouge
. This massacre lead by Pol Pot began in 1970 ( AT THE PEAKOF SUNSPOT ACTIVITY) and ended in 1979, during a decline in sunspots.
Image #4 Below
Stalins great terror began September 1936, a time of increasing sunspot numbers and ended in 1938, at the small decline in sunspots.
So we can conclude that rising or peaking periods of solar activity lead to major events negatively affecting the human population.
If you want to see each and every conflict between nations, this excellent paper
shows each conflict around each sunspot cycle. Backp Link:
http://www.ez3dbiz.com/violence_and_sunspots.pdf
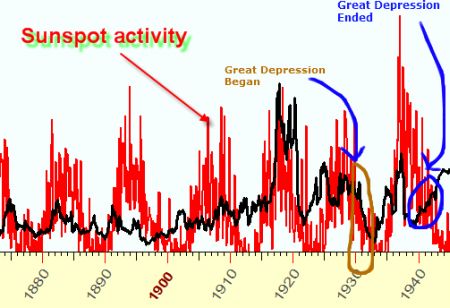
What is most interesting is that great monetary depressions, where large scale financial establishments are "wiped out" occur during flat sunspot periods.
Sunspots and the Great Depression
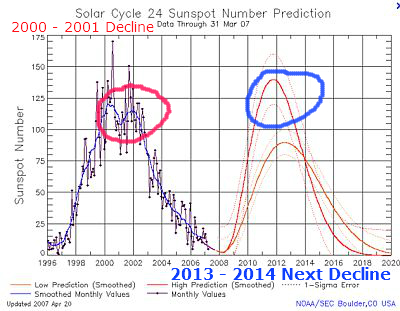
Because sunspots have a motivational/stimulative effect, during declines when sunspot activity has peaked, especially when the cycle before has been stronger, we get depressions in the monetary system. As the chart below shows, the last great depression began at a low of sunspot activity in 1933. We are about to experience another dramatic low starting around 2014, peaking to as low as 4.1 sunspots during December 2019.
The 2008 Stock Market Crash. If you look at the image above titled Sunspot Solar Cycle 24, you will see that we had the market crash in the United States, which occurred during September 2008, a peak low period of sunspot activity.
Future Sunspot Levels: http://www.swpc.noaa.gov/ftpdir/weekly/Predict.txt
Image #5 Below
The 1973-1975 recession
was another depression in the markets. These all take up the same pattern. They all occur during a lower sunspot cycle that was higher than the previous sunspot cycle. As we can see in Image #4, the 1970 sunspot cycle was lower than the 1960 sunspot cycle. As we can see in Image#3, the sunspot cycle in 2000, was lower than the previous sunspot cycle (called sunspot cycle 22), and we can see in Image #4 and Image #5, the great depression also began at a sunspot cycle that was lower, than the previous one.
Looking Ahead into the Future
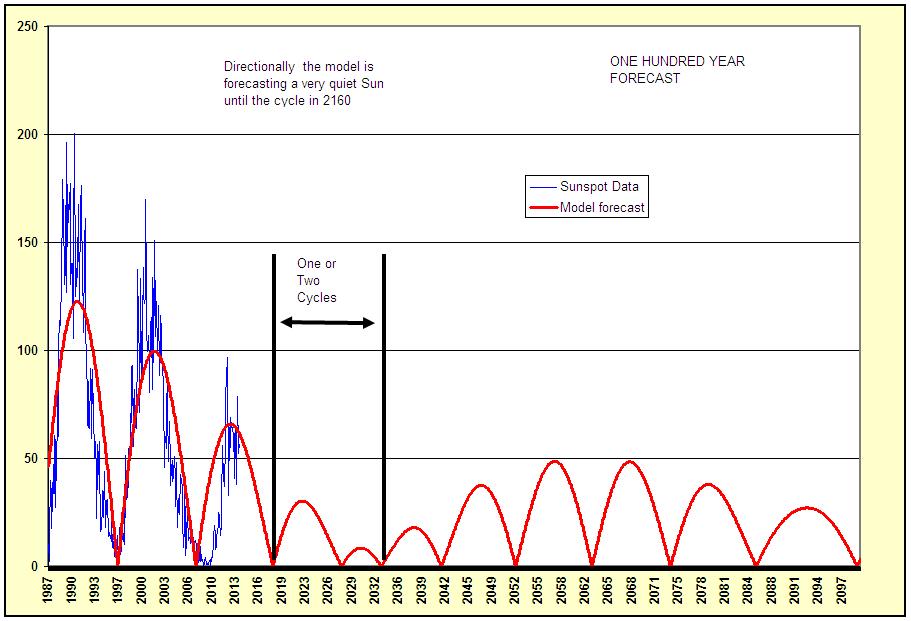
According to Image #3, between 2025 and 2030 there will be another great depression, if nothing is done about our monetary fiscal fiasco. This occurs because sunspot cycle #25 is much, much lower than any other cycle since the 1940's.
So in conclusion, when the last sunspot cycle peaked higher before the current one, as soon as the current sunspot cycle reaches its new low, it becomes a period of major financial crises, usually followed by war. Hopefully by 2025, we will be educated enough as a species to make prudent changes so that history does not repeat itself.
Sunspots, Confidence and Perception
During higher periods of solar activity
, which can last up to 5 years) and condition blue periods
,which last for a few days, belief in oneself is more prevalent. It means more people in the general population have the belief that they have the capability to succeed at something or a stronger feeling of certainty they have about something. They feel quite certain that they can achieve success.
Because consumer confidence levels are actually the levels of confidence consumers have in the future, it means that they have a feeling of certainty that they have the ability to succeed and can succeed in what they are attempting. It means having a feeling of certainty rather than having certainty. More sunspots stimulate these feelings of increased confidence.
Increasing confidence is based on a person’s perception. In a nutshell, the difference between a person who has confidence and a person who doesn’t have confidence may only boil down to their individual perception. As this article
states " Perception is relative to the speed of the observer
." Rising sunspot levels change and alter our perception. When we have achieved high levels of confidence from a high sunspot period or condition blue period, and suddenly the sunspots begin dropping, or we enter an overall lower sunspot cycle (which can last for 3 years or more), our perception is still riding on the previous "high"
, which creates a feeling of overconfidence. What we percieved was causing us to belive in ourselves, has temporarily faded. We than discover that we are not getting the same usual results that we are used to get. This may begin a cycle of lower self confidence and lower expectations. Until we reevaluate our perception, it can make us depressive and fearful about the future
So when condition blue periods first start dropping or a lower sunspot cycle period is starting, we should prepare more thoroughly than usual, and to a certain extent, never let the perception of our confidence level stop us from moving ahead, making progress and furthering our goals. If we are in business, especially sales, and condition blue periods are flat and/or consumer confidence levels are low, than we need to re-evaluate our perception of the situation or products that are being sold.
References:
Do Sunspots Reflect Consumer Confidence? An Empirical Investigation by Sharon G. Harrison (Columbia University)
http://ideas.repec.org/a/eej/eeconj/v31y2005i1p55-73.html
Physics Professor Dr. David Bohm discusses Perception and the Human Mind
http://www.youtube.com/watch?v=Mst3fOl5vH0
Mass Incidents of Human Destruction and KP Levels (Geomagnetic Activity)
If we go into further detail and dissect each event according to the level of Geomagnetic Activity that occurred when the incident occurred, we get some very interesting findings.
Proving Innocence Versus Intentional Manslaughter. A guide for Judges and Lawyers
We can now use this energy to determine if somebody had a bad intention to inflict violence as we shall show below.
We can prove in this case
that because the sunspots did not drop 3 days in a row it was not done on purpose. This
89 year old person never even had a citation in his life and yet he killed those people.
View 2006 Sunspot Archive for the date of July 16th
This page will go into more detail about the many cases where declining sunspots as well as additional factors show that it creates negative intentions.
Just as the energy from a condition yellow causes a powerful resonance to occur
(which we use for healing) that can last for days if the conditions are right, this same effect can occur if the mind undergoes fear and panic during a condition yellow. Instead of healing, it may cause panic, illness, or drain the body of vital healthy energy. Perhaps during the condition yellow periods a type of portal into the collective unconscious mind occurs where this energy enters strongest, with the effects lasting on human consciousnesses for as long as the solar wind and solar flux are at high levels.
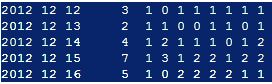
Jump in the Solar Wind - Major Stimulation Occured http://rwc.lund.irf.se/rwc/dst/archive.php?year=2012&month=12&date=14.png
Numerical KP Levels Peaked http://www.swpc.noaa.gov/ftpdir/indices/old_indices/2012Q4_DGD.txt
3rd Indicator (Not as Powerfull)Sunspots Decreased: http://www.swpc.noaa.gov/ftpdir/latest/DSD.txt
We can see the Sun's Solar Flux Activity Levels showed a slight Decline:
http://www.swpc.noaa.gov/rt_plots/xray_5m.html
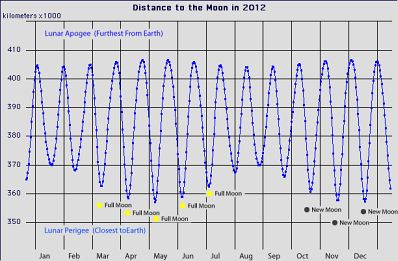
As mentioned earlier, December 14th was also very close to the 2012 December perigee supermoon. This was during a new moon period. As this graph shows
the moon was closer to the earth during December
and peaking on December 13th, 2012. You can learn more at this link
. This next Perigee Moon peaks in March of 2013 and will be a full moon perigee instead of a new moon Perigee. These moons are usually associated with increased earthquake and other earth change activity.
The 2nd energetic power influence is the period 3 to 4 days just before or after a New Moon. Though not as powerful as solar conditions, it is still an influencing factor. Even when solar conditions are perfect, the period just before a new moon can create negative violent behaviour. Take the case studies below:
** 18,495 records from patients admitted to a psychiatric hospital in an 11-year period: admissions for psychosis were highest during the new moon and lowest during the full moon
** 25,568 psychiatric emergency room visits in a 13-year period: visits increased near the first quarter moon and a decreased around the new moon and full moon
** 7,844 emergency calls to a suicide prevention/crisis call center in a 2-year period: the highest number of total calls was during the new moon, not the full moon. When calls for suicide threats were analyzed, there were more calls during the first quarter of the moon and new moon
** 76,065 calls to a crisis center in a 4-year period: increased calls by females during the new moon period; decreased calls by males during the new moon period.
** 928 suicides in a 4-year period: suicides did not increase during the full moon. In fact, more suicides were noted during the new moon
Reference Source: Washington State University
One excellent way to use this information to predict future outbursts of violence is to look for a trend of violence forming using the model of declining sunspots and higher KP values, than when the next condition orange occurs, be on the watch for erratic behavior that could cause problems. This model works best from June to December.
Prolonged condition purple periods can also lead to unexpected acts of violence, however the damage and impact caused is on a much lesser scale.
Prolonged condition purples can inhibit personal frustrations, which can come from things not going the way they used to. More information can be found
on the Sun Color Meanings Page
page.
I believe that the reason the outbursts of violence do not continue when condition oranges continue to occur, is because people have been made aware of outbreaks of violence in the past, and are more on the lookout for it. Higher KP values bring with them increased awareness, and I believe this awareness "spreads" to other people, kind of like a mental virus. This proves that a higher KP as well as a leap in the solar wind causes an increased awareness, depending on what you want you are focusing on at the moment.
Next Case
Over 80 people have died in two bomb blasts in Aleppo university
on Wednesday January 16th. This occurred during a condition orange period which happened over the last few days. View Archive
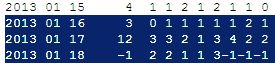
Sunspot Levels below are on the far right.
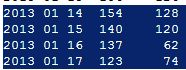
Sunspot Historical Data Courtesy of NOAA
http://www.swpc.noaa.gov/ftpdir/indices/old_indices/2013Q1_DSD.txt
Next Case
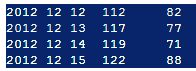
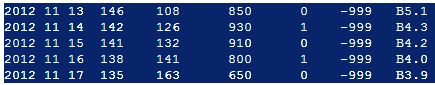
November 15th, 2012 The Solar Health Condition was
80% Yellow and 20% Orange -- VERY POWERFUL STIMULATION PERIOD OCCURING ON THIS DAY -----
An Israeli airstrike on Gaza occured on this date, which led to massive ridiculous violence in the days after this date. As you can see condition Oranges start after this date

Sunspot Levels are the 2nd row. On the far right is the suns X-ray background radiation levels which were in decline for 3 days. The Sun's X-Ray background levels is the amount of thermal radiation coming from the sun. When these are at high levels they trigger a condition red .
Sunspot Historical Data Courtesy of NOAA
http://www.swpc.noaa.gov/ftpdir/indices/old_indices/2012Q4_DSD.txt
Next Case
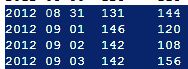
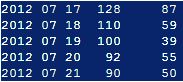
3rd September 2012 - Four South African miners shot as strikes spread after Marikana massacre
KP Levels for this period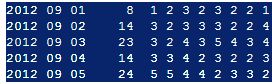
KP Historical Data courtesy of NOAA
http://www.swpc.noaa.gov/ftpdir/indices/old_indices/2012Q3_DGD.txt
Sunspot Levels below are on the far right.
Sunspot Historical Data Courtesy of NOAA
http://www.swpc.noaa.gov/ftpdir/indices/old_indices/2012Q3_DSD.txt
Below is a more detailed indepth investigation.
View Historical Solar Wind Data
View Historical KP Storm Data
View Numerical KP Levels
Ocean Wave Tidal Frequency
Sunspot Levels
Next Case
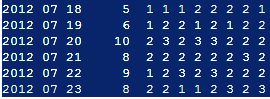
Aug 13th, 2012 - 3 killed in mass shooting near Texas A&M
- Solar Wind Speeds had been at high speed for 2 days and a rise in KP also occured. A condition yellow
was present a few days before.We will go into more detail about conditions yellows further down this page.
KP Levels for this period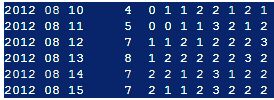
KP Historical Data courtesy of NOAA
http://www.swpc.noaa.gov/ftpdir/indices/old_indices/2012Q3_DGD.txt
Sunspot Levels below are on the far right.
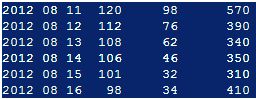
Sunspot Historical Data Courtesy of NOAA
http://www.swpc.noaa.gov/ftpdir/indices/old_indices/2012Q3_DSD.txt
Below is a more indepth investigation.
View Historical Solar Wind Data
View Historical KP Storm Data
View Numerical KP Levels
Ocean Wave Tidal Frequency
August 13th, 2012. Sunspots Peaked 4 days before
and started dropping around time of event.
Sunspot Levels below are on the far right.
Sunspot Historical Data Courtesy of NOAA
http://www.swpc.noaa.gov/ftpdir/indices/old_indices/2012Q3_DSD.txt
Below is a more indepth investigation.
View Historical Solar Wind Data
View Historical KP Storm Data
View Numerical KP Levels
Sunspot Historical Data Courtesy of NOAA
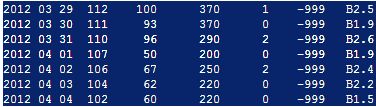
http://www.swpc.noaa.gov/ftpdir/indices/old_indices/2012Q2_DSD.txt
A more detailed investigation is below:
Solar Wind Speeds
were at 450 a few days before the event
KP Levels
peaked a few days before the event
Ocean Wave Tide Frequency
April 2, 2012. Sunspots Peaked 4 days before
and started dropping around time of event.
Next Case
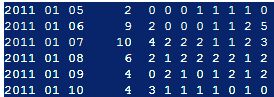
December 13, 2011 - BELGIUM - Gunman Nordine Armani kills three people, including a 17-month-old toddler, and wounds dozens in a central square in the eastern city of Liege, before shooting himself.
KP Levels for this period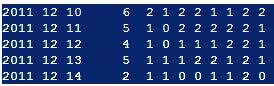
KP Historical Data courtesy of NOAA
http://www.swpc.noaa.gov/ftpdir/indices/old_indices/2011_DSD.txt
Sunspot Levels below are on the far right.
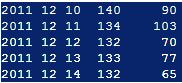
Sunspot Historical Data Courtesy of NOAA
http://www.swpc.noaa.gov/ftpdir/indices/old_indices/2011_DSD.txt
Below is a more indepth investigation.
Solar Wind Speeds
KP Levels
peaked 4 days before
Ocean Wave Tide Frequency
.
December 13, 2011. Sunspots Peaked 4 days before
and started dropping around time of event.
Next Case
July 22, 2011 - NORWAY - Police seize a gunman who killed 69 people at a youth summer camp of Norway's ruling political party, on the small, holiday island of Utoeya.
KP Levels for this period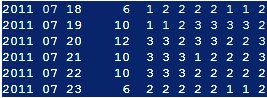
KP Historical Data courtesy of NOAA
http://www.swpc.noaa.gov/ftpdir/indices/old_indices/2011_DSD.txt
Sunspot Levels below are on the far right.
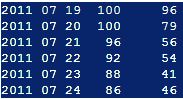
Sunspot Historical Data Courtesy of NOAA
http://www.swpc.noaa.gov/ftpdir/indices/old_indices/2011_DSD.txt
Below is a more indepth investigation.
Solar Wind Speeds
KP levels
peaked 3 days before
Ocean Wave Tide Frequency
.
July 22, 2011. Sunspots Peaked 4 days before
and started dropping around time of event.
Next Case
January 8, 2011 - UNITED STATES - Then-U.S. congresswomen Gabrielle Giffords is target of an assassination attempt in Arizona in which sixpeople are killed and 13 wounded.
THIS WAS AN OUTDOOR EVENT WHICH WAS MOTIVATIONAL IN NATURE - SO HIGHER KP ENERGY WAS MORE PREVALENT
Sunspot Levels below are on the far right.
Sunspot Historical Data Courtesy of NOAA
http://www.swpc.noaa.gov/ftpdir/indices/old_indices/2011_DSD.txt
Below is a more indepth investigation.
KP levels
peaked 2 to 3 days before the event
Solar Wind Speeds
Ocean Wave Tide Frequency
.
January 8, 2011. A lower number
of sunspots 4 days before.
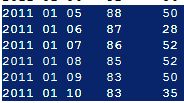
June 2, 2010 - BRITAIN - Gunman Derrick Bird opens fire on people in towns across the rural county of Cumbria. Twelve people are killed and 11 injured. Bird also killed himself KP levels
at extremely high levels 3 days before the event Solar Wind Speeds
at High Levels
KP Levels for this period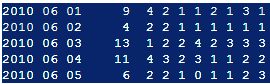
KP Historical Data courtesy of NOAA
http://www.swpc.noaa.gov/ftpdir/indices/old_indices/2010_DSD.txt
Sunspot Levels below are on the far right.
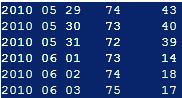
Sunspot Historical Data Courtesy of NOAA
http://www.swpc.noaa.gov/ftpdir/indices/old_indices/2010_DSD.txt
Below is a more indepth investigation
Ocean Wave Tide Frequency
June 2, 2010. Sunspots in decline
last few days.
March 11, 2009 - GERMANY - A 17-year-old gunman dressed in combat gear kills nine students and three teachers at a school near Stuttgart.
He also kills one other person at a nearby clinic.
This occurred during a full moon
.
There were no sunspots because this was a during sunspot minimum as shown in the graph below. At lower sunspot periods we can see that the higher KP causing these incidents occur further apart, than the usual 24 to 48 hour window. This suggests that higher solar activity "speeds things up", allowing acts to take place sooner and events to transpire faster than usual.
KP Levels for this period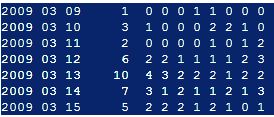
KP Historical Data courtesy of NOAA
http://www.swpc.noaa.gov/ftpdir/indices/old_indices/2009_DGD.txt
Sunspot Levels were 0.
It appears that during sunspot minimums, a new or full moon with higher KP creates more outbreaks of violent behaviour.
http://www.swpc.noaa.gov/ftpdir/indices/old_indices/2009_DSD.txt
KP levels
peaked 4 days before
Solar Wind Speeds
Ocean Wave Tide Frequency:
Next Case
September 23, 2008 - FINLAND - Student Matti Saari opens fire in a vocational school in Kauhajoki in northwest Finland, killing nine other students and one male staff member before killing himself.
This was also the date of a full moon
KP levels
reached a peak Solar Wind Speeds
KP Levels for this period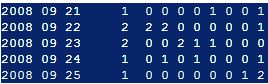
KP Historical Data courtesy of NOAA
http://www.swpc.noaa.gov/ftpdir/indices/old_indices/2008_DGD.txt
Sunspot Levels below are on the far right. Remember, this is during a sunspot minimum. These were the first sunspots that occurred after a period of quiet activity.
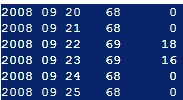
Sunspot Historical Data Courtesy of NOAA
http://www.swpc.noaa.gov/ftpdir/indices/old_indices/2008_DSD.txt
Below is a more indepth investigation.
Ocean Wave Tide Frequency:
Jan. 10, 2008 - Solar Cycle 24 Begins
Next Case
November 7, 2007 - FINLAND - Pekka-Eric Auvinen kills six fellow students, the school nurse, the principal and himself with a handgun at the Jokela High School near Helsinki
KP Levels for this period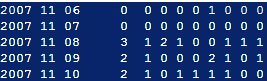
KP Historical Data courtesy of NOAA
http://www.swpc.noaa.gov/ftpdir/indices/old_indices/2007_DGD.txt
Sunspot Levels below are on the far right.
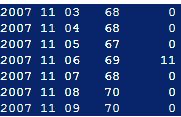
Sunspot Historical Data Courtesy of NOAA
http://www.swpc.noaa.gov/ftpdir/indices/old_indices/2007_DGD.txt
More Indepth Investigation Below:
KP levels
Solar Wind Speeds
Next Case
April 16, 2007 - UNITED STATES - Virginia Tech, a university in Blacksburg, Virginia, becomes site of the deadliest rampage in U.S. history when a gunman kills 32 people and himself.
This was a few days from a new moon
Also if you view the sunspot archive
, you will see this was the first set of active sunspots in 10 days
KP Levels for this period
KP Historical Data courtesy of NOAA
http://www.swpc.noaa.gov/ftpdir/indices/old_indices/2007_DGD.txt
More indepth investigation below
Sunspot Levels below are on the far right. This period was also close to a new moon.
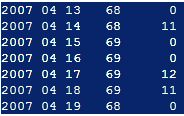
Sunspot Historical Data Courtesy of NOAA
http://www.swpc.noaa.gov/ftpdir/indices/old_indices/2007_DGD.txt
KP Levels
Solar Wind Speeds
Ocean Tidal Wave Frequency
Complete Archive Courtesy of NOAA is available at this web address:
http://www.swpc.noaa.gov/ftpdir/indices/old_indices/
Because we are in Period #3
, whenever there is a condition Orange Forecast
, the results are greatly amplified, which is why we see more mass shootings occuring during this period. Between early 2014 and 2017 when a condition green is forecast
, it will result in an increase in peace, calm and harmony, and the destructive condition oranges will end.
If you note the data from above, the KP peaks occur just before the psychological outbreak of violence and the solar winds peaked approximately 96 hours before the violence.
After solar Cycle 24 begins as shown in the data below, you will notice that the events occur sometimes 3 to 4 days before the psychological outbreak of violence and the higher solar wind speeds are closer to the outbreak of violence. This means that the outbreak of violence energy manifests sooner at the start of a new sunspot cycle and towards the end of a sunspot cycle, the outbreak of violence energy takes a little longer to manifest itself, making forecasting a bit more tricker.
When there are higher KP levels that occurred from an event in the past, it has more impact on people when they read about it or hear about it. Examples are the September 11th, 2001 event, the Virginia Tech event. Because these events occurred at such high KP levels, it is easy to use these circumstances to create agendas or new legislation. No matter how many new laws are made, they will never stop new events from occurring as higher KP events are always going to occur in the future. The best way to off-set these large acts of random violence is by predicting when these events are going to occur, than performing acts of kindness meditation or global coherence exercises as shown on the HeartMath website
. This hopefully will than change the mind of the individuals thinking about creating these acts, thus deterring acts of large scale violence. This I hope will be a way to stop these terrible events from occurring. Local acts of violence which impact less than 8 people are caused by local geomagnetic fluctuations, which can be measured using local geomagnetic KP measuring stations shown below.
Local Geomagnetic Activity Stations:
Second Real Time Geomagnetic Pulsations with Interactive Map
http://geomag.usgs.gov/map/#storm/16
Real Time Geomagnetic Pulsations with Interactive Map
http://www-ssc.igpp.ucla.edu/uclamag/themis_center/
USGS Local Geomagnetic Stations http://geomag.usgs.gov/realtime/
http://geomag.usgs.gov/realtime/basic.html
Geomagnetic kp and ap Indices http://www.ngdc.noaa.gov/stp/geomag/kp_ap.html
Northwest Research Associates Geomagnetism Disturbances Forecast 20 days out:
http://www.nwra.com/spawx/ap.html
Additional Sources:
http://www.ngdc.noaa.gov/geomag-web/?id=igrfwmmFormId#igrfwmm
Source 2
http://www.wdc.bgs.ac.uk/
World Magnetic Model Calculator
What Is a Natural Source of Infrasonic Waves?
The ocean is one of the biggest natural generators of infrasound
, according to Milton Garces of the University of Hawaii, Manoa. Source: EHOW.com
Infrasonic waves are also called, Microbaroms, which are regular pressure variations of a few microbars (dyn cm−2) produced by the passage of infrasound (5 see period) radiated from ocean waves
Source: Amestoc
Under proper conditions and using the correct equipment and setup, ( full sound scale speakers, including infrasound ) in an enclosed, hall type setting or room, infrasound frequencies can be directed to affect humans physiologically, and will affect / direct brainwave activity and brainwave states
, physical / bodily functions, and produce various physical and sensory response.
Source: Naked Science
The Effects of Infrasonic Waves upon Biological Beings
A change in the ocean's tidal wave frequency causes behavioral changes in a large scale region of populated people. It also affects wide regions of the earth, from animals to plants and insects. Therefore if this energy is entering our consciousness from an exterior point, there must be some way that this energy can be projected outwards. This is where The Sonic Weapon
of Vladimir Gavreau comes from. There is also this excellent research article
showing that a Bigfoot Entity is using infrasonic waves to stay "invisible" and cloak himself using infrasonic waves. Perhaps the surrounding forest environment, of which this entity is in harmony with is also assisting in the infrasonic waves to help keep it hidden from physical view.
Some dogs can "smell" the infrasounds which can be measured in seawater
before a storm.
Source: EarthPulse
At 1:52 minutes into this video
, a bigfoot crosses about 80 feet in front of 3 people, and the people don't even see it until they playback the video later.
Here is another excellent research site
discussing how bigfoot uses infrasound to stay invisible.
Infrasonic waves can come from the ocean, as well as from large tropical storms, volcanoes, earthquakes, black holes and meteorites. The further out into space you get, the longer and more deeper these infrasonic waves pulsate. I believe these infrasonic waves travel along the ley lines assisting or riding along the waves of telluric energy and exit outwards at certain points called platonic grid points. The 2 most powerful platonic grid points on earth are located in Paris, France and Hawaii
.
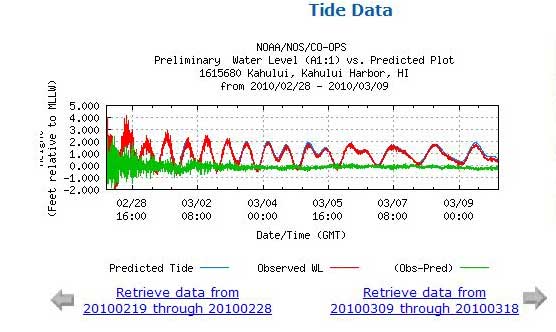 Click the picture on the left to view real time values of these changing tides, as well as future predictions of frequency "shifts". Because one of these grid points is located in Hawaii, when this energy exits we can watch it as a change in the tidal wave frequency. This change in ocean frequency is what is responsible for a change in the condition colors
, moving from one phase to the next, as well as changes in the stock market
, and violent mood and behaviour swings
.
Click the picture on the left to view real time values of these changing tides, as well as future predictions of frequency "shifts". Because one of these grid points is located in Hawaii, when this energy exits we can watch it as a change in the tidal wave frequency. This change in ocean frequency is what is responsible for a change in the condition colors
, moving from one phase to the next, as well as changes in the stock market
, and violent mood and behaviour swings
.
Infrasonic waves have been shown to affect the pituary / pineal glands of our brains. This small pine cone shaped organ acts as a receiver and transmitter
, which is like an antenna in our bodies.
References:
Using Infrasound to Listen to the Earth Breathing by Lorella Abenavoli - View Article
Ocean circulation generated magnetic signals
5NOAA’s National Geophysical Data Center, Boulder, U.S.A. - View Research Paper
Electromagnetic Ocean Effects National Geophysical Data Center NOAA - View Research Paper
Low Latitude infrasonics associated with geomagnetic activity
Geophysical Journal of the Royal Astronomical Society - View Research Paper
Explaining Ghost Sightings (Part 4 – Infrasound)
War for Science - View Research Paper
Other Infrasonic Source References
:
Infrasound Laboratory, University of Hawaii, Manoa. View Site
Solar and Lunar Tides by GS Journal. View Site
Science and the Sea. View Site
INFRASOUND AND THE INFRASONIC MONITORING OF ATMOSPHERIC NUCLEAR EXPLOSIONS. View Site
Infrasonic Sound Simplified. View Site
As stated earlier, the reason I choose Hawaii to view the changes in the tidal frequency is because it sits on a Platonic Earth Grid Point. I believe that as this energy manifests, just like a release of energy from an earthquake causes the plates to shift. it comes through at these points, changing or altering our consciousness, which than affects social and biological systems on earth. You can learn more about these grid points at Montalk.net
or by viewing page 21
of the Becker-Hagens Planetary Grid System Coordinates article.
So in summary, when the sun is increasing or declining in its sunspot strength, it amplifies considerably the results of original intention put forth, and if you happen to be around a large group of people, it affects them also. The most deadly period is when sunspot activity has been at high levels, and then just suddenly "deflates" and is heading into a quiet period. When a "ripple effect" in the solar wind occurs, as in the case of the solar wind jumping
which will usually coincide with a peak in the geomagnetic activity
, this is the trigger point, which will usually cause an event that will affect a larger segment of the population. The opposite is true also, when sunspots increase and there is a ripple in the solar wind, the Dow Jones rises
.
At 3:50 minutes into the below video, we explain that during the condition yellow period more amounts of HGH are being produced in the body.
Individuals who abuse HGH drugs experience more intense mood swings, producing episodes of rage and sometimes violence.
Source: EHow.com
Enter -- human growth hormone + violent behavior -- into Google and many scientific references come up linking HGH to violent behavior.
This would mean a diet of junk food and lack of exercise causes a lack of HGH to naturally occur in the body, meaning that some people "crave" HGH and act out in violence to induce this "natural high". As quoted in the below article:
Significant increases in hGH secretion were observed only when TRH and psychological stress were combined as stimuli.
Source: U.S. National Library of Medicine
While we can only speculate, I believe that proteins are playing a part. Proteins express themselves through human behavior at high KP levels. If you eat lots of meat, it may express itself through violence and low vibration thoughts. If you get your protein through plant based foods, it expresses itself through thoughts of a higher vibration such as peace, kindness and progress, rather than destructive violence.
Meat Eating and Violence
Recent studies show that trace levels of multiple pesticides cause increased aggression. At least seven studies have demonstrated that violent criminals have elevated levels of steroids, pesticides, antibiotics and other toxic chemicals in their bodies, compared with prisoners who are not violent. In a Harvard Study conducted in 1998 rats receiving natural food and hotdogs became violent and fought aggressively.
http://www.celestialhealing.net/mentalveg2.htm
They easily cheat, tell lies, they forget promises, they are dishonest and tell bad words, steal, fight and turn to violence and sex crimes," the book states on page 56 http://www.huffingtonpost.com/2012/11/17/indian-textbook-meat-eaters-violent-dishonest-sex-criminals_n_2150611.html
References
Suicidal Behavior and Meterological Conditions
" there seems to be a marked correlation between suicide and winds, particularly according to their direction. Thus, winds charged with ionised particles seem to coincide with a high rate of self-destruction.
"
Paper published by US National Library of Medicine
Chronomics of Suicides and the Solar Wind
" Salib & Cortina-Borja (2006) report an association between month of birth and suicides and this complements findings concerning the season of death in Minnesota. Along the scale of a calendar year, suicides peaked in April to June, which was later than mortality from heart disease and earlier than mortality from accidents.
"
Paper published by the British Journal of Psychiatry
Historical Data Provided by NOAA:
http://www.swpc.noaa.gov/ftpdir/indices/old_indices/2012Q2_DSD.txt
Historical Data Provided by List of events named massacres by Wikipedia
http://en.wikipedia.org/wiki/List_of_events_named_massacres
Space Weather Archives courtesy of NOAA
17 years of Historical Archives
New Books